GBP to XAF chart
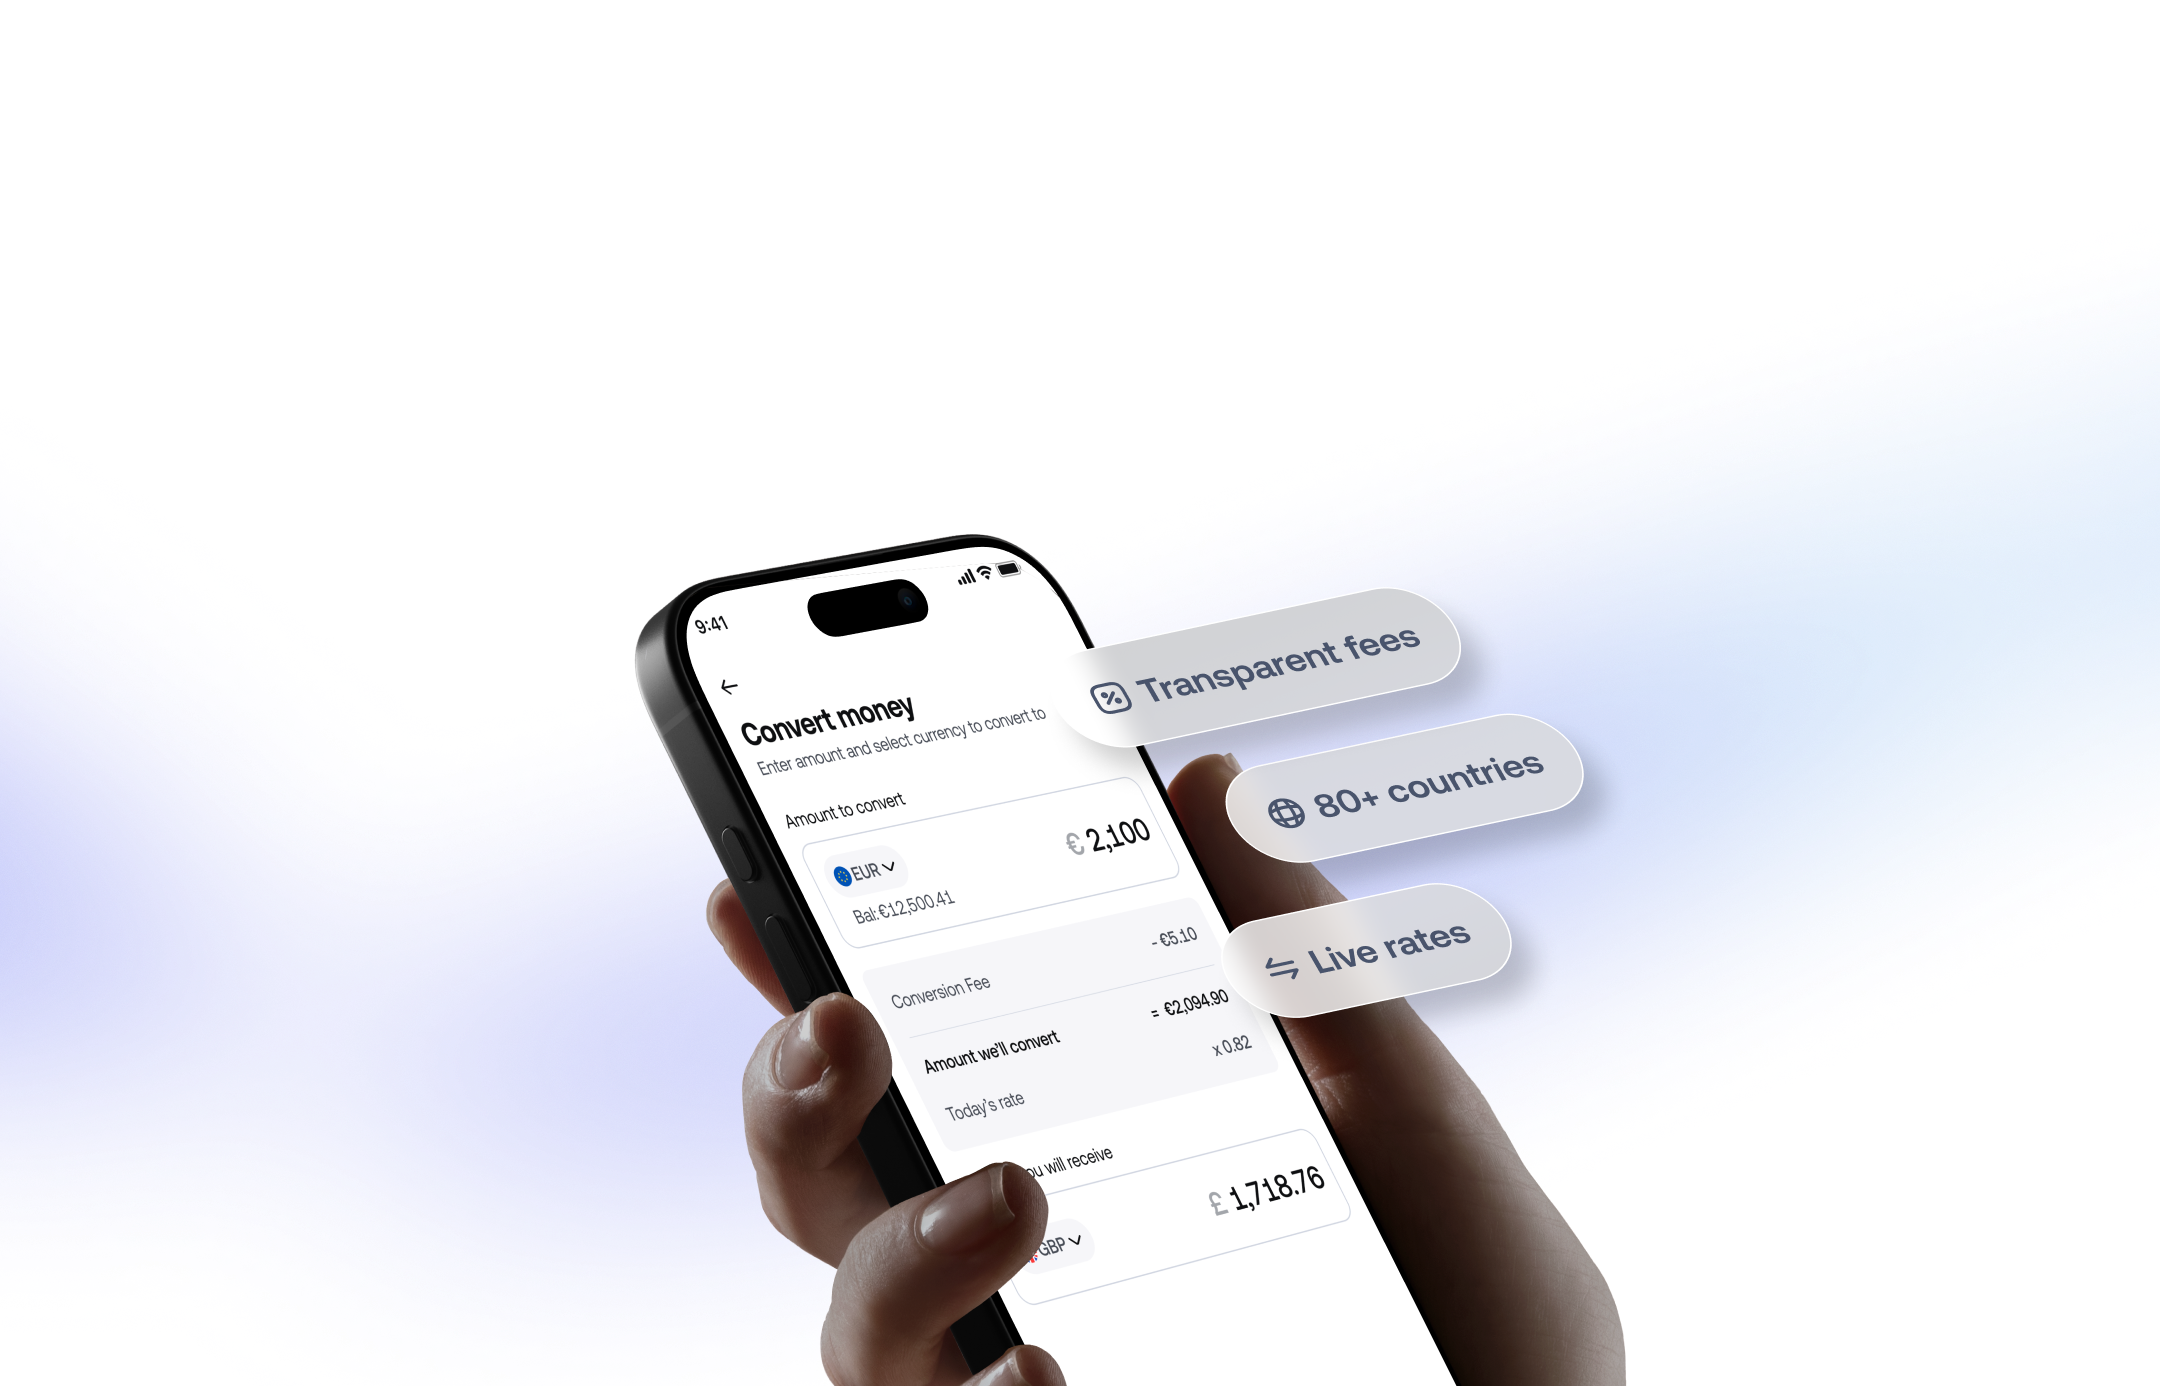
Use the chart to see the recent trend for GBP to XAF. The line shows the mid-market rate over the period you pick, and Grey's own conversion fee is shown separately before you confirm a transfer.







| Period | High | Low | Average | Change |
|---|---|---|---|---|
| 30 days | 13.9 | -25.0 | -5.1 | -116.7% |
| 90 days | 13.9 | -34.0 | -15.8 | -115.1% |
| |
|---|---|
| 1 GBP | 771.14 XAF |
| 5 GBP | 3,855.70 XAF |
| 10 GBP | 7,711.40 XAF |
| 20 GBP | 15,422.80 XAF |
| 50 GBP | 38,556.99 XAF |
| 100 GBP | 77,113.99 XAF |
| 250 GBP | 192,784.97 XAF |
| 500 GBP | 385,569.95 XAF |
| |
|---|---|
| 10,000 XAF | — |
| 50,000 XAF | — |
| 100,000 XAF | — |
| 200,000 XAF | — |
| 250,000 XAF | — |
| 500,000 XAF | — |
| 1,000,000 XAF | — |
| 1,500,000 XAF | — |