GBP to USDC chart
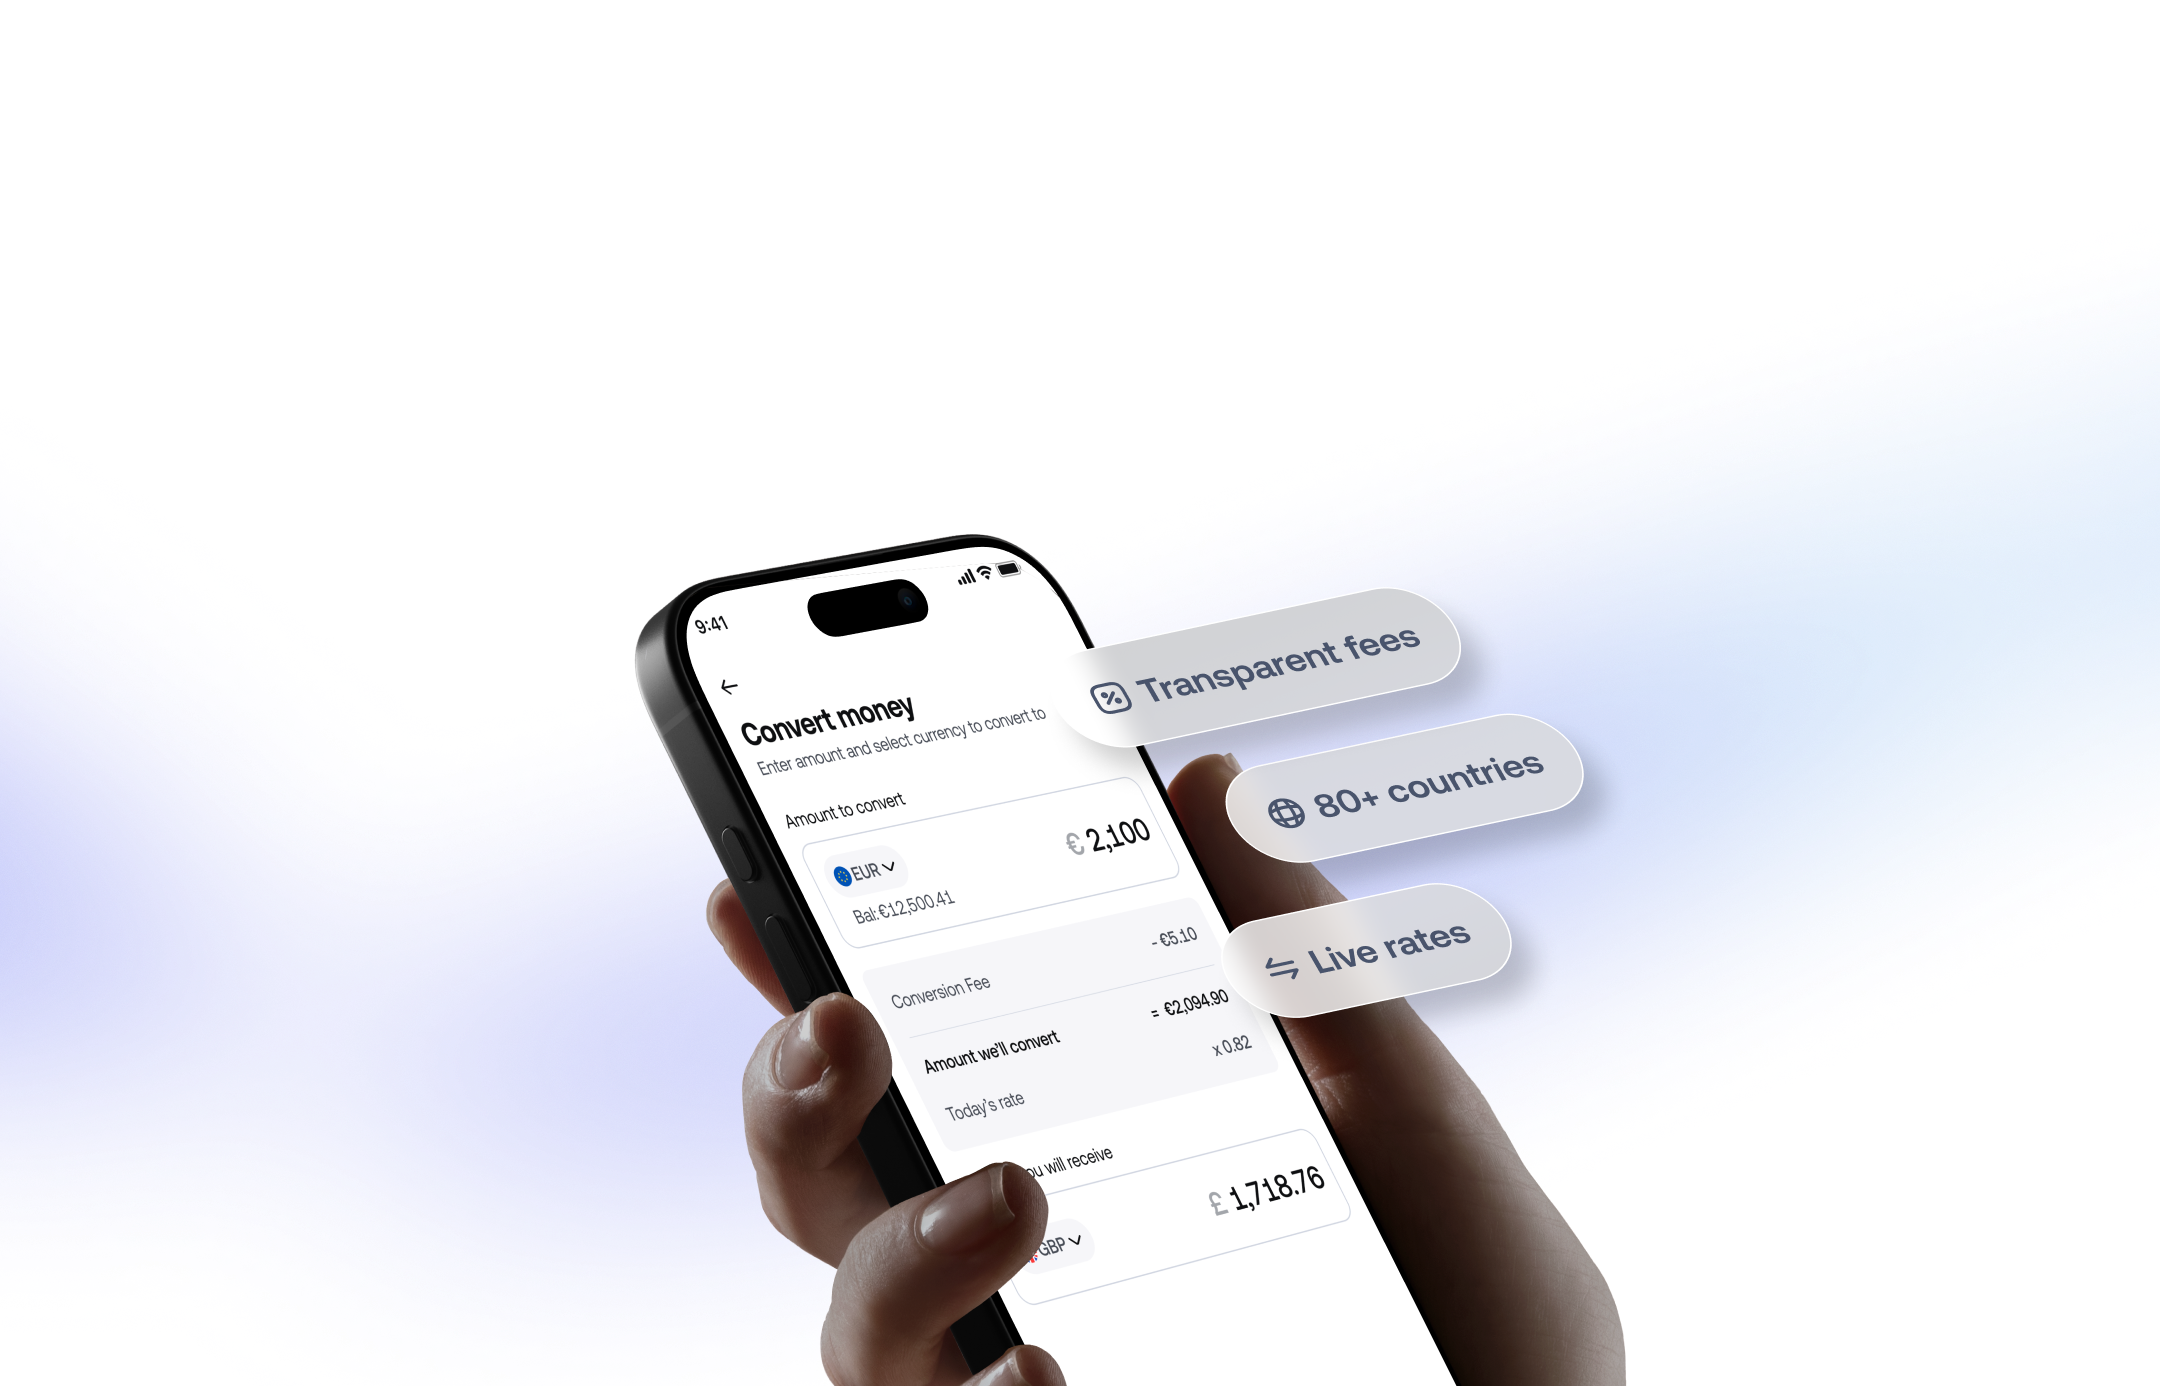
Use the chart to see the recent trend for GBP to USDC. The line shows the mid-market rate over the period you pick, and Grey's own conversion fee is shown separately before you confirm a transfer.







| Period | High | Low | Average | Change |
|---|---|---|---|---|
| 30 days | 13.9 | -25.0 | -5.1 | -116.7% |
| 90 days | 13.9 | -34.0 | -15.8 | -115.1% |
| |
|---|---|
| 1 GBP | 1.30 USDC |
| 5 GBP | 6.48 USDC |
| 10 GBP | 12.95 USDC |
| 20 GBP | 25.90 USDC |
| 50 GBP | 64.75 USDC |
| 100 GBP | 129.50 USDC |
| 250 GBP | 323.75 USDC |
| 500 GBP | 647.51 USDC |
| |
|---|---|
| 10,000 USDC | 7,402.97 GBP |
| 50,000 USDC | 37,014.85 GBP |
| 100,000 USDC | 74,029.69 GBP |
| 200,000 USDC | 148,059.38 GBP |
| 250,000 USDC | 185,074.23 GBP |
| 500,000 USDC | 370,148.45 GBP |
| 1,000,000 USDC | 740,296.90 GBP |
| 1,500,000 USDC | 1,110,445.35 GBP |